
Data visualization
Executive dashboards and reporting.
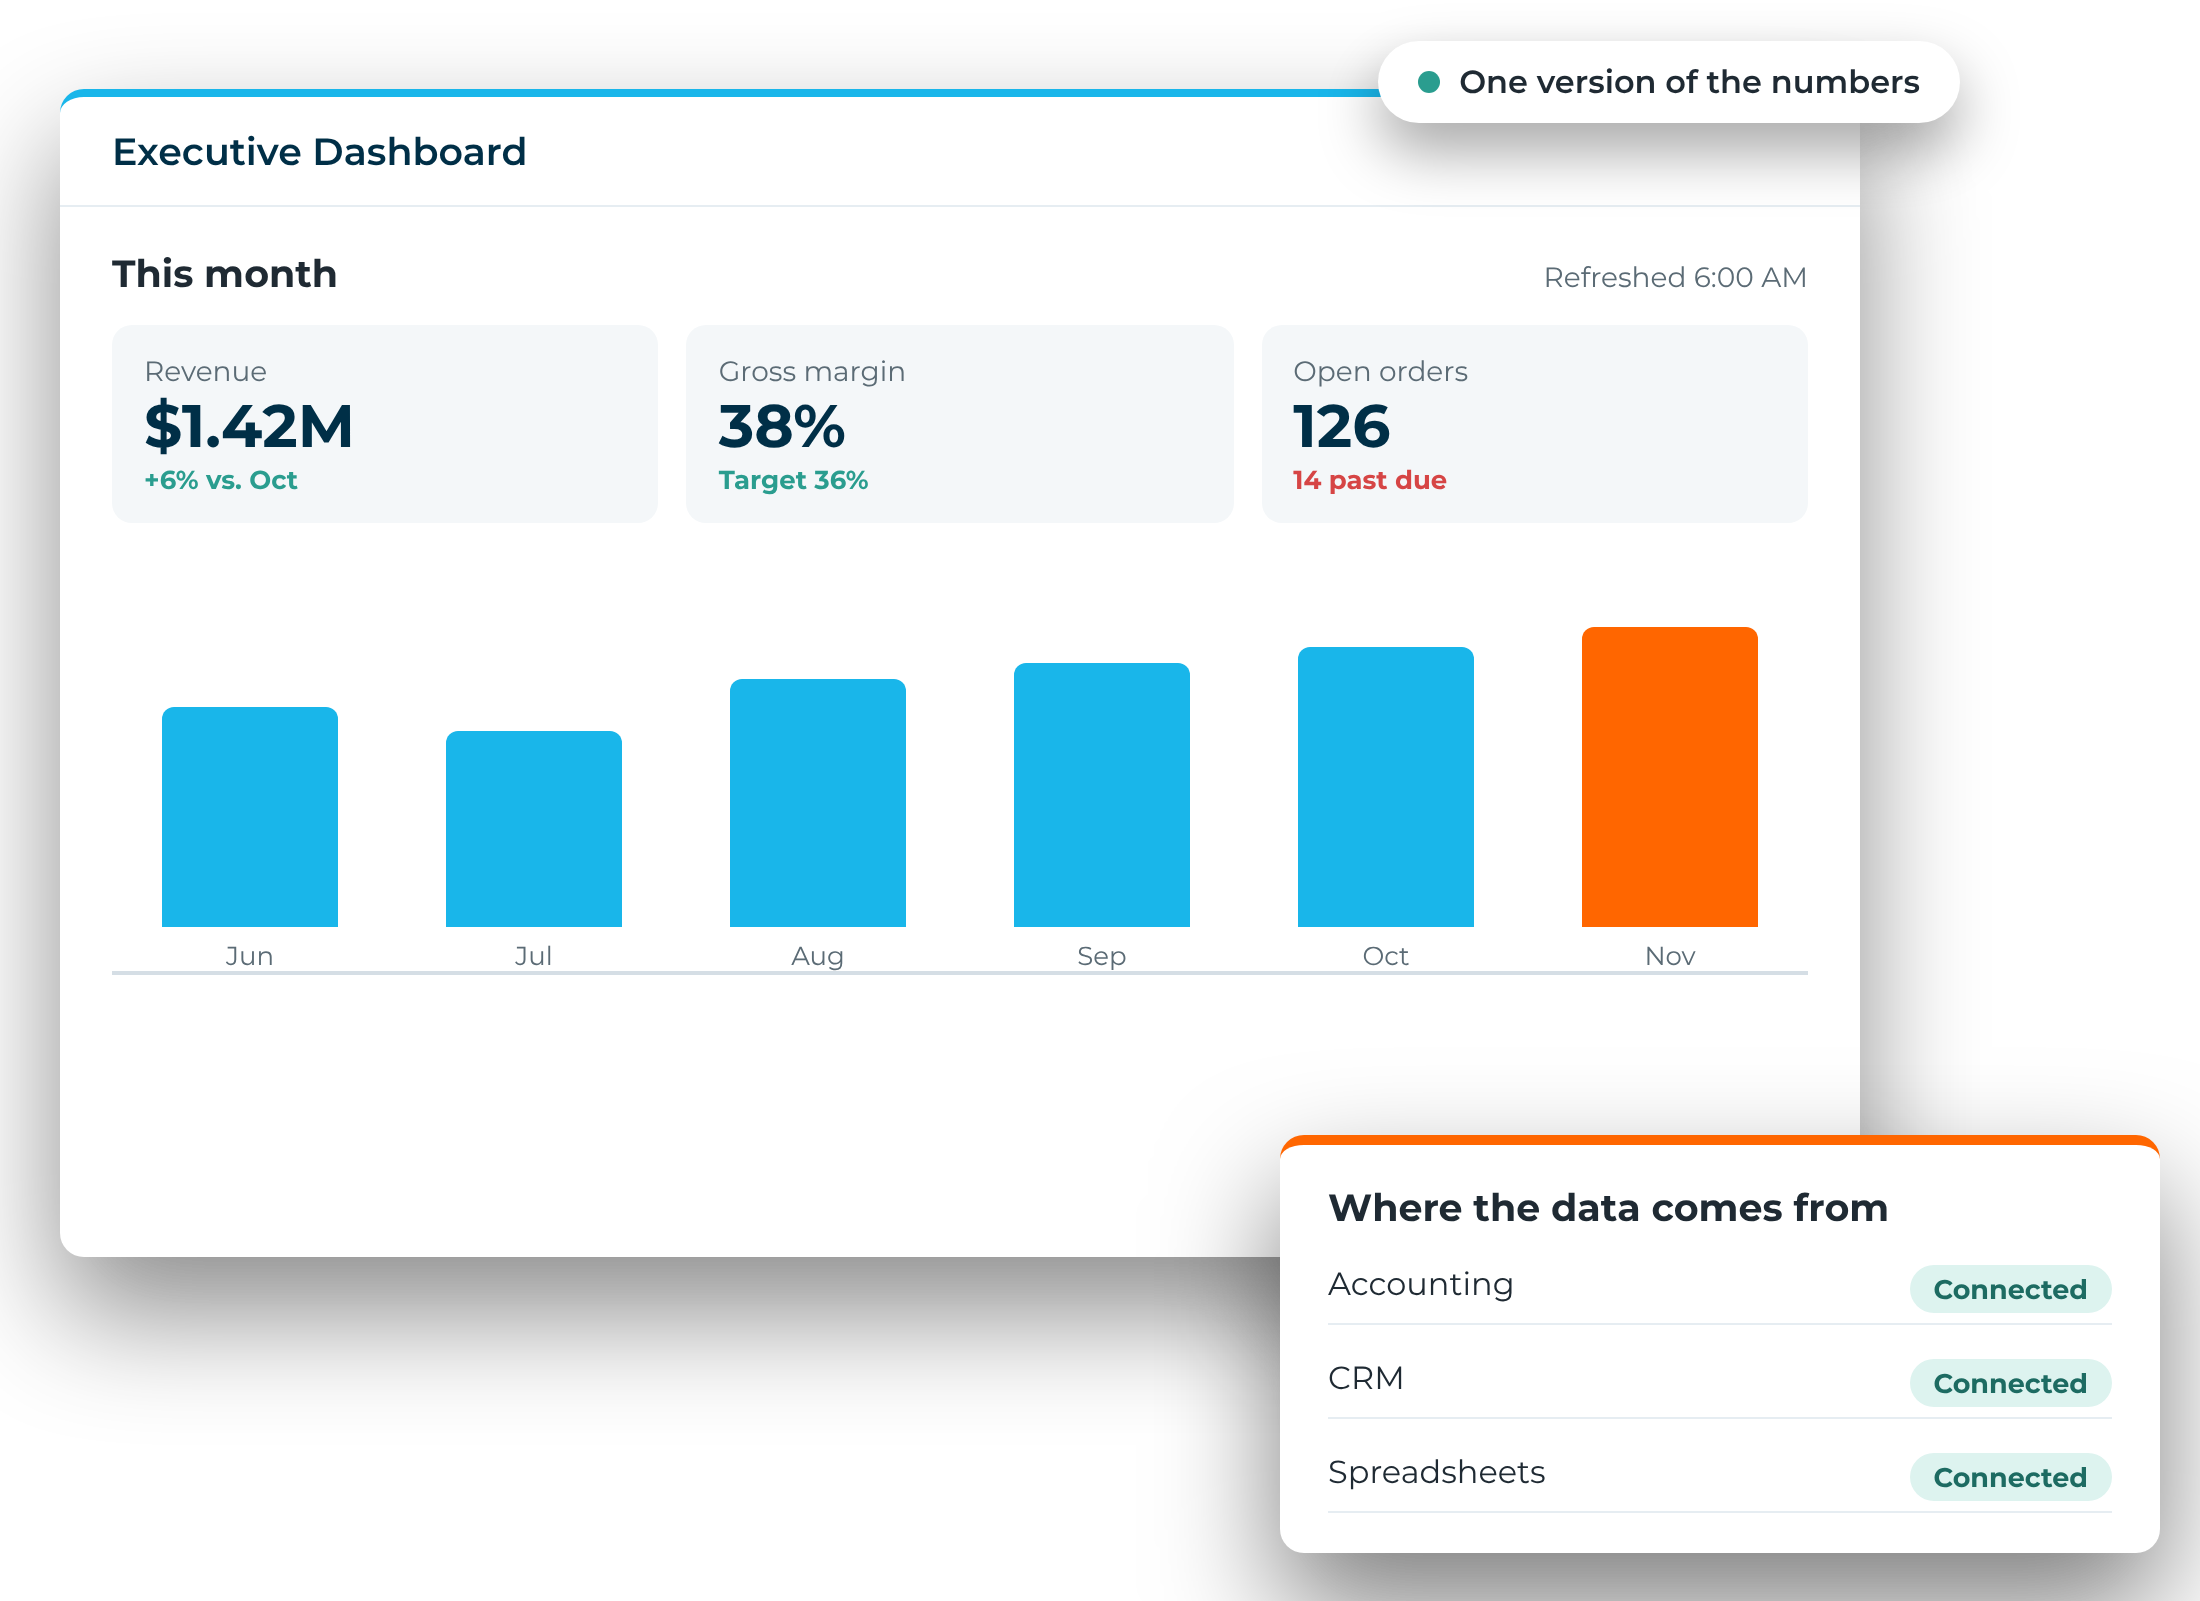
Your business generates data every day. We turn scattered spreadsheets into clear, real-time insight with custom data visualization tools designed for the way you work.
How we approach it
- Highlight the right KPIs at the right time, with the right tool
- Automated reporting instead of a manual rebuild
- Spreadsheets, systems, and cloud apps linked with the proper APIs
- Insights when they matter, not at the end of the month
- Visual alerts that flag problems before they grow
Built with Excel, Power BI, Airtable interfaces
Questions
Are the dashboards generic charts?
No. From interactive dashboards and dynamic charts to custom reports and KPI trackers, each one is built around your data and how the team uses it.
Book a free strategy call.
30 minutes. No pitch. Just clarity on what's slowing your team down.