Imagine an ocean teeming with vast, intricate information that boggles the human mind. Welcome to the world of big data! This colossal domain houses an enormous wealth of structured and unstructured data, challenging traditional analytics tools due to its complexity.
Big data is often measured in petabytes, exabytes, and even zettabytes – a scale far beyond everyday comprehension. That’s because 2.5 quintillion bytes of data are generated every single day.
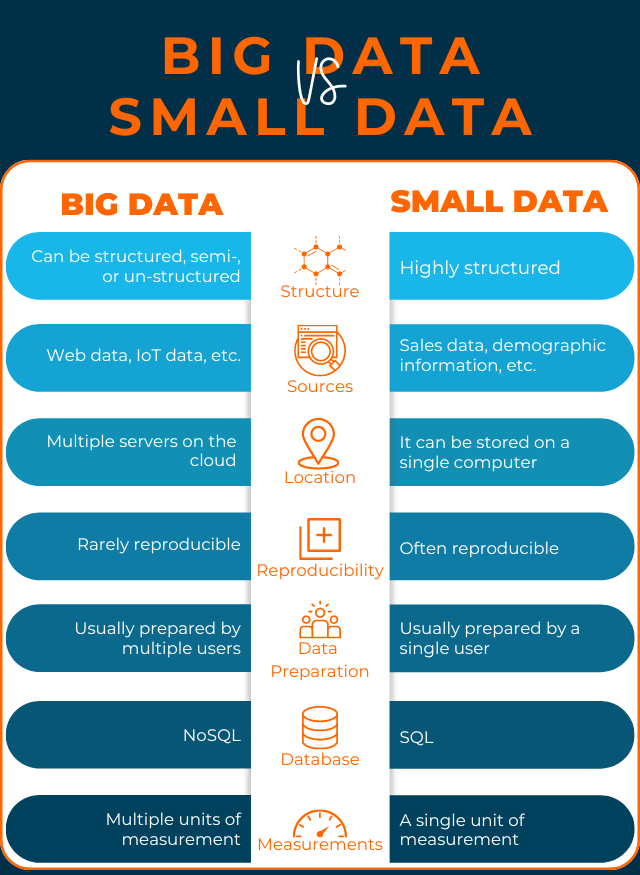
On the other hand, we have small data –but it’s not exactly “small” per se. The data helps us understand the bigger picture and frame our decisions. This guide will discuss the differences between big and small data, how to turn big data into small data, and how to make your data work for you.
What is Big Data?
What exactly constitutes big data? It’s essentially the massive volume of digital information generated every second from various sources. Think about social media interactions, emails flying across cyberspace, detailed logs tracking user activities, and much more—all contributing to this ever-expanding repository.
Big data doesn’t stop with digital information like emails and images; it also encompasses real-world input from sensors or Internet of Things (IoT) devices embedded within industrial equipment or healthcare gadgets. These cutting-edge inventions continuously gather crucial information as they operate – further enriching our understanding of various aspects spanning multiple industries.
In today’s rapidly evolving landscape, where knowledge is power and innovation is critical, big data holds the potential to unlock unprecedented insights that can catapult businesses toward unparalleled success. Embrace this fascinating realm of possibilities and prepare for a future defined by intelligent decision-making based on robust evidence!
The Dimensions of Big Data
Big data is an evolving concept encompassing vast information from various sources and formats. The five Vs—volume, variety, velocity, integrity, and value—provide a framework for understanding its characteristics.
Volume refers to the sheer amount or scale of daily data businesses and individuals produce. With the advent of social media, IoT devices, and online transactions, there has been an exponential increase in data needing processing. This massive volume can be challenging to manage but holds great potential for analysis.
Variety concerns the diversity in sources and types of data that require processing. Data can come from multiple channels such as social media feeds, customer interactions, or sensor readings; it can also take on different formats like structured text (databases), unstructured text (emails), audio recordings (phone calls), videos, or images. Managing this diverse range necessitates versatile tools capable of handling distinct formats.
Velocity relates to how quickly we must process data due to its time-sensitive nature. For instance, real-time analytics on stock markets or traffic patterns require rapid interpretation before their relevance diminishes. Consequently, organizations need efficient systems capable of managing high-speed streaming inputs while delivering timely results.
Veracity focuses on ensuring that collected data is accurate and reliable for analysis. Inaccurate or incomplete information may lead to false conclusions and misguided decision-making efforts; therefore, constant validation checks are critical during collection processes and subsequent stages within analytical workflows.
Value represents big data’s ultimate goal: extracting meaningful insights that drive better decision-making across healthcare and finance industries. By harnessing these insights effectively, organizations can improve operations efficiency levels while enhancing overall performance metrics considerably over timeframes previously considered impossible using traditional means alone.
Understanding these dimensions—volume, variety, velocity integrity, and value—helps businesses navigate their approach to leveraging big-data solutions more efficiently. This ultimately leads to improved insight-driven decision-making processes, enabling growth opportunities previously undreamt of even just a few short years ago!
Benefits of Big Data
Big data offers numerous advantages through valuable insights. Some key benefits include:
Enhanced Precision
Big data’s larger sample size significantly improves accuracy, reducing bias and errors in decision-making. This heightened precision is crucial for businesses that rely on reliable information to make informed choices and engage in long-term planning strategies.
Improved Trend Analysis
With access to extensive historical and current information, businesses can better understand trends, allowing them to make well-informed decisions regarding future strategies. Big data helps companies identify patterns and shifts in consumer behavior or market conditions, enabling proactive responses.
Strategic Forecasting
Big data enables organizations to create long-term strategies and projections by identifying industry-shaping trends from large datasets. This comprehensive view of the market landscape allows for more accurate forecasting, helping businesses stay ahead of their competition.
Increased Innovation Potential
Access to expansive datasets empowers businesses to experiment and innovate more effectively. By uncovering insights into new markets, products, or services previously unexplored, organizations can capitalize on untapped opportunities for growth and diversification – fueling innovation-driven success.
Understanding Small Data
Small data refers to easily understandable and processable information derived from significant data sources such as customer trends, financial analysis, or sales forecasting. Examples include specific Google search results, social media sentiment analysis on certain topics, or annual sales figures for individual products.
Benefits of Small Data
Choosing small data over big data brings numerous perks to the table:
Simplified Analysis
The ease of interpretation makes small data a go-to option for obtaining swift answers without getting lost in a labyrinth of complex information. Its simplicity promotes efficient problem-solving and decision-making processes.
Actionable Insights
Small-data findings, such as customer experiences or market trends, provide timely and accurate guidance for decision-makers. These pointed insights enable businesses to make well-informed choices that positively impact their organizations’ performance.
Cost Efficiency
Small data is more straightforward to analyze and interpret than large datasets, but its processing proves more cost-effective than big-data solutions. As a result, many companies prioritize leveraging small-data approaches, avoiding the hefty expenses of managing extensive volumes of information while reaping valuable insights.