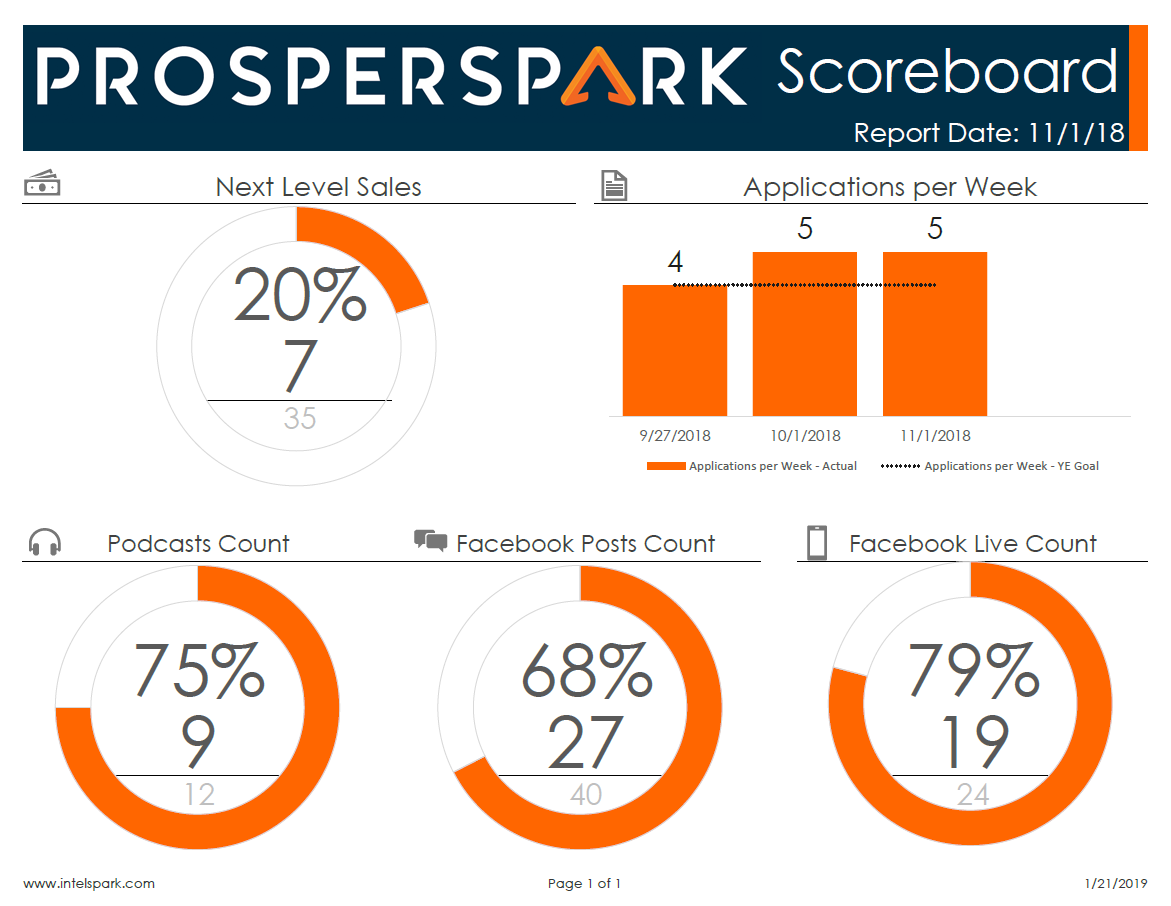
Scoreboard
Visual. Performance Snapshot. All in Excel.
Microsoft Excel Consulting
Background
The client needed a simple way to see a snapshot of their performance.
The scoreboard allowed for simple daily input on a separate tab in the Microsoft Excel file. The scoreboard automatically updates after each input.
Why You Want One
Modern
Design is important. Spreadsheets don’t need to be (and shouldn’t be) boring. They should tell a story.
Easy
Who has time to go into 7 tabs each day? We don’t. See updates immediately after a few inputs on one tab.
Cost Effective
No licenses. No monthly cost. A Microsoft Excel scoreboard allows you to distribute to as many or as few users as you want.
Scalable
It works whether you have 5 rows, 5k rows, or 500k rows. The tool grows with you.
Flexible
You won’t need to call us next year so the tool works for the next year. It’s robust and flexible to handle a variety of input.
Client Pain Points
Not Visually-Appealing
It was difficult to understand the data. There were not charts present to visualize performance. It looked more 1999 than 2019.
Time-Consuming
The client felt their current tool was cumbersome and time-consuming to update.
Inaccurate
Their current tool did not calculate consistently and accurately. There were several formulas errors.
Several Tabs
The user was required to go into several tabs in order to populate the tool each month.