Look What I Did
Spoiler Alert: I shamelessly self-promote our services here at ProsperSpark in Omaha, Nebraska.
You just built a sweet Excel spreadsheet.
It does everything your boss wants it to do. It tracks all of those pesky [insert your company’s key data points here].
It looks good.
It looks really good.
I mean, you even used the company’s logo, color scheme, and everything.
There’s just one problem. It’s super hard to update.
There are 100+ columns. It takes a while to enter a new row for each contract, sale, piece of equipment, service performed, or whatever else your company tracks religiously.
All that scrolling left and right to enter one row of data… it’s just too much.
Knowing the Possibilities
Half the battle is typically knowing what can be accomplished, not how.
Do you think Steve Jobs knew how he was going to create a brand new industry when the iPhone idea was pitched to him?
I highly doubt it.
What he did know was that touchscreen technology existed. He knew that mobile internet access was possible. He also knew that he had an army of software engineers at his disposal.
The point here is this; know what’s possible and then worry about how to execute. The same goes for your Excel spreadsheet or automation (VBA macros) project.
Keep this in mind; anything you do in Excel can be automated for the most part. Here’s a short list of examples of what you can automate within Microsoft Office.
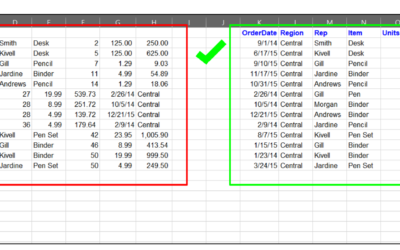
- Cleaning up an export file; rearranging columns, deleting rows/columns, etc.
- Importing data. This includes opening a file, copying data, pasting into a different file/tab, and then closing the original file.
- Clearing a form.
- Parsing data. Maybe you get a report where all of the names/addresses are in one cell. This can be automatically separated into multiple columns.
- Extracting data from an automated email you receive. (Yes, even in Outlook.)
- Updating data, text, and/or charts in a PowerPoint presentation right from Excel.
- Scraping data from the internet and inputting into an Excel database.
- Sending weekly individual reports (like commission statements, performance reports, managerial KPI’s, etc.) out in a matter of a few seconds.
Bottom line, you may have graduated in 1999, but your spreadsheets don’t have to look and operate like they are.

The Numbers
You have got a great idea. It takes about 5-8 minutes to add a new row because you have to continually reference different fields in the database and other information from the client email.
You are going to automate the input. You’ve seen a few videos where somebody creates a form in Excel to update a database.
The company has grown quite a bit in the last year or two. You know that you will need to have better record keeping so you can leverage that data to win more future business. You know that in today’s age, companies don’t survive if they don’t employ data analytics.
Someone will be entering 15-20 entries every day. The hope is that the number of entries rises because if it does, that means the business is growing.
You start doing the math.
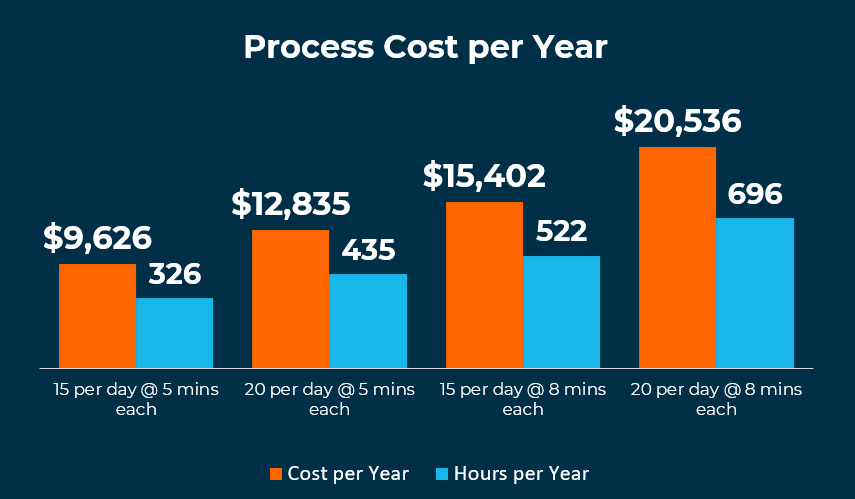
That means that in this example, the cost ranges from $9,620 to $20,536 depending on how many entries per day (15-20) and how long it takes (5-8 minutes)
The Math (Click Here to See Calculations)
There are 261 working days in a year. That means between 3,915 – 5,220 entries per year. Take that times 5 minutes per entry, and you get 326 – 435 hours in a year. That’s 8 to 11 full 40-hour workweeks.
At 8 minutes a piece, it comes out to 522 to 696 hours annually or 13 to 17+ workweeks.
The median household income according to an article on CNBC online, in 2018 was $61,372. That means that based on 2,080 working hours per year, the average rate per hour is $29.51. Take this hourly rate and multiply it times the annual hourly estimates provided above to get the annual cost estimates.
Yowser.
Sally, the sales administrative assistant, can get faster over time and she will probably be able to multi-task while she’s doing it.
Sure.
That’s probably a fair expectation. However, how much of an impact will that truly make? Ten percent? Twenty percent? Fifty percent?
You wouldn’t bet anything above twenty percent.
The Task
For the sake of example, let’s say you are attempting to generate sales quotes and record the deal details in Excel.
Looking at the data, you know that more often than not the company is quoting the same configurations over and over again.
That’s when you have a great idea.
Why don’t we have a few buttons that pre-populate specific deal configurations for the quote in Excel? Well, if that’s possible, why can’t we have that same data be recorded in a database for data analytic purposes?
You can.
You can also have a button that exports your quote to a PDF with a dynamic name, saves it to a specified folder, and attaches it to a customized email. During this process, your sales database is updated with that quote with all of the pertinent details; quote number, sales rep, cost, price, margin, configuration, etc.
This all happens in a few seconds.
There’s just one problem. You have no idea how to do this.

Using Your Resources
That’s when you call Jim.
Yep, that Jim.
He’s the guy that you know is going to scold you for building it the wrong way. Now, he may not outright tell you that… but he lets you know.
Jim is the company’s de facto “spreadsheet guy.” Every company has a “Jim.” He is the guy that does all of that advanced Excel stuff throughout the company.
There’s just one problem.
Jim has a real job. He is also the [insert Jim’s title here]. He’s got a full plate of work already, and it’s going to be several weeks or a few months before he can even look at a project that doesn’t help reduce his workload.
Saving Time & Making Life Easier
Now that you have an idea of what you can automate, it’s time for action.
Don’t be the one who settles for “it will be fine” or “we will figure it out.”
Expect more.
Nothing says you have to hire us here at ProsperSpark. Heck, nothing says you have to hire an outside firm or consultant. However, if you read my last article on this topic, you already know it’s in your best interest to do so.
You’re a good recruiter, plumber, electrician, therapist, insurance firm, mechanic, dentist, lawyer, [insert your profession here.] Either way, you know Excel spreadsheets are not your forte.
What you do know, is that spending $9,620 to $20,538 per year is crazy talk. Cutting that in at least half is more than doable and necessary.
This is why successful businesses, possibly your competitors, are automating processes where they can.
Stagnant processes cost you time and money.
That’s why automating processes should be a priority for your business.
Solution
You decided “it will be fine” was not fine.
You took action.
You picked up the phone and called ProsperSpark (okay, hopefully, you called us).
The solution was rather straight-forward. Instead of one large database, there was a simple button that the user clicks to pop up a form. The form is user-friendly with preset options for the sales configurations you typically present to your customers. All of the pertinent deal details were all visible on the screen in an organized fashion.
No more scrolling left and right.
Click a button to save it, and it adds the deal details to a database. It then automatically updates your new sales dashboard (yep, ProsperSpark creates these too).
To send it to the client, all you have to do is click a button, and the quote is exported to PDF. It is then saved to your shared drive, named appropriately with the client’s name, and attached to an email with the client’s email already populated.
All you have to do is hit send. It took just a few seconds to generate the PDF and email.
In the end, you cut your data entry time in about half; from 5-8 minutes to 2-4 minutes. Additionally, the entire PDF quotation generation time is now about a fourth of what it was before
You have a whole lot more time. What do you do with this new found time?
Whatever you want!
Maybe it’s more sales calls, more time for projects, or more time with your friends and family.
The bottom line is that more time allows you to improve your business and life.
Google “VBA macro consulting [insert your city name here].” Find a reputable consultant and reach out to them.
Stop accepting tedious and time-consuming tasks as “it’s just the way it is” and let someone help you.


